1. Status of Elephants in India Report (2025) – Environment

Why in News?
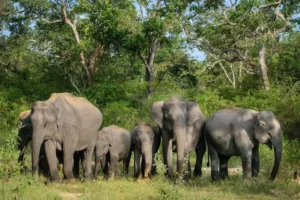
On October 14, 2025, the Wildlife Institute of India (WII) released its latest report titled “Status of Elephants in India.”This marks the first-ever DNA-based national elephant census, offering improved accuracy and insights into population dynamics.
Key Highlights of the 2025 Report
New Methodology: DNA-based Mark-Recapture
Used for the first time in India between 2021–2025.
Involves collecting dung samples and extracting genetic data to track individual elephants, reduce duplication, and ensure reliable counts.
Offers insights into sex ratios, kinship networks, and migration patterns.
Elephant Species in Focus
Species: Asian Elephant (Elephas maximus)
IUCN Status: Endangered
Legal Protection:
Schedule I of the Wildlife (Protection) Act, 1972
Appendix I of CITES (Convention on International Trade in Endangered Species)
Population Estimate (2025):
Total Wild Asian Elephants in India: 22,446
(↓ from ~29,964 in 2017 — reflects more accurate data, not necessarily a decline)
Regional Distribution:
| Landscape | Population | Share (%) |
|---|---|---|
| Western Ghats (Karnataka, Kerala, TN) | 11,934 | ~53% |
| North-East & Brahmaputra Plains | 6,559 | ~22% |
| Shivalik Hills & Gangetic Plains | 2,062 | ~9% |
| Central India & Eastern Ghats | 1,891 | ~8% |
Conservation Framework in India
Project Elephant (1992)
Launched by the Ministry of Environment, Forest and Climate Change (MoEFCC) to:
Protect elephant habitats and corridors
Reduce human-elephant conflict (HEC)
Support research and monitoring
Encourage eco-development and community participation
Elephant Corridors
India has ~101 elephant corridors, many of which are threatened by:
Habitat fragmentation
Linear infrastructure (roads, railways)
Urbanization and mining
Conservation Implications & Recommendations
Key Insights:
DNA profiling has provided better demographic data, enabling smarter policy.
Highlights the need to restore corridors for unhindered migration.
Stress on integrating elephant movement patterns into land-use planning.
WII Recommendations:
Genetic Census every 5 years
Corridor Restoration
Human-Elephant Coexistence Models in planning and development
Community Engagement and Awareness
Exam Connect – Possible Questions
Prelims
1. Which of the following techniques was used in the 2025 elephant census in India?
A. Camera trap surveys
B. Satellite telemetry
C. DNA-based mark-recapture
D. Acoustic monitoring
Answer: C. DNA-based mark-recapture
2. Under which schedule of the Wildlife (Protection) Act, 1972 is the Asian elephant protected?\
A. Schedule II
B. Schedule I
C. Schedule III
D. Schedule IV
Answer: B. Schedule I
Mains
1. “Accurate wildlife population data is crucial for effective conservation.” Discuss the significance of India’s first DNA-based elephant census in the context of biodiversity preservation and sustainable development.
2. Examine the challenges faced in the conservation of Asian elephants in India. What role can land-use planning and corridor protection play in addressing these challenges?
2. Delhi’s Winter Air: Meteorology, Climate Dynamics, and the Fight for Clean Skies – Environment

Why in News?
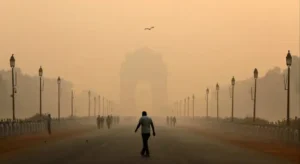
Delhi, infamous for its winter air pollution, experienced temporary relief in 2025, largely due to unusual meteorological conditions:
Early monsoon withdrawal,
Western disturbances,
Shifting ENSO (El Niño-Southern Oscillation) conditions.
However, experts stress that the improvement is climate-driven, not policy-driven, indicating the need for systemic long-term interventions.
Key Meteorological & Climate Dynamics at Play
1. Early Monsoon Withdrawal (2025)
Earliest since 2002, which facilitated:
Better wind movement,
Rainfall events clearing particulate matter,
Reduced atmospheric stagnation, a major pollution trigger.
2. ENSO & La Niña Influence
India is currently in ENSO-neutral transitioning to La Niña.
La Niña typically enhances surface winds, helping disperse pollutants.
Historical studies show La Niña years record lower pollution spikes.
Pollution Sources & 2025 Scenario
Stubble Burning
Severe flooding in Punjab and Haryana delayed crop harvests.
This temporarily reduced stubble burning, a major seasonal pollutant.
Firecrackers & Judicial Intervention
Supreme Court permitted use of “green firecrackers”.
However, studies show:
Green firecrackers emit ~30% less pollutants,
But still contribute significantly to PM2.5 and PM10 spikes, especially during Diwali.
Monitoring & Data Challenges
Data Transparency Gaps:
Several AQI monitors show incomplete data, especially during late-night and early-morning hours when pollution peaks.
Underreporting masks actual severity, misleading public perception and delaying policy urgency.
Systemic Challenges
Reliance on Meteorological Luck
2025’s improvement is weather-aided, not due to governance or emission reduction.
Without systemic changes, air quality could worsen in future unfavorable climate years.
Long-Term Solutions & Strategy
1. Source-Based Pollution Control
Target transport emissions, construction dust, and open waste burning.
Transition to clean fuels and EV infrastructure.
2. Agricultural Reform
Promote happy seeders, crop diversification, and incentivize non-burning practices.
3. Airshed Management Approach
Air pollution is transboundary — coordinated planning is needed across:
Delhi-NCR, Punjab, Haryana, UP, Rajasthan.
Shared emission inventory, joint protocols.
4. Community Engagement
Urban behavior change (e.g., carpooling, reduced generator use) is vital.
Citizen science & local awareness campaigns to improve accountability.
Exam Connect – Possible Questions
Prelims
1. La Niña conditions are typically associated with which of the following effects in North India during winter?
A. Suppression of surface winds
B. Increased rainfall and stronger surface winds
C. Enhanced crop burning activity
D. Strengthening of winter fog events
Answer: B. Increased rainfall and stronger surface winds
2. What is the primary pollutant responsible for severe air quality deterioration in Delhi during winter?
A. Ozone
B. Nitrogen Dioxide
C. Particulate Matter (PM2.5 and PM10)
D. Sulphur Dioxide
Answer: C. Particulate Matter (PM2.5 and PM10)
Mains
1. Delhi’s temporary air quality improvement in 2025 highlights the role of climate variability more than policy effectiveness. Critically analyse the limitations of current air pollution strategies and suggest systemic reforms.
2. Discuss the concept of “Airshed Management” in the context of India’s urban air pollution crisis. How can regional cooperation and governance be strengthened for cleaner air?
3. Arsenic Toxicity in Rice Cultivation – Science & Technology
Why in News?
A recent study has shown that microbial communities in rice paddies play a critical role in the formation and absorption of toxic arsenic compounds in rice grains. This insight could transform how we approach rice cultivation in arsenic-affected regions like Bihar, West Bengal, and Bangladesh.
The Science of Arsenic Toxicity in Rice
What is Arsenic (As)?
A carcinogenic heavy metal and phytotoxin.
Commonly present in groundwater used for irrigation in parts of South and Southeast Asia.
Rice absorbs arsenic more efficiently than other cereals because it is typically grown in flooded (anaerobic) conditions.
How Arsenic Becomes Toxic in Rice Paddies:
| Process | Description |
|---|
| Anaerobic Soil Conditions | Waterlogged paddy soils become low in oxygen, creating ideal conditions for microbes that transform arsenic. |
| Methylating Microbes | Convert inorganic arsenic (As³⁺, As⁵⁺) into organic forms: • DMA (Dimethylarsinic acid) • DMMTA (Dimethylated Monothioarsenate) — highly toxic |
| Demethylating Microbes | Break down organic arsenic species back into less toxic inorganic forms, reducing overall toxicity. |
| Key Insight | Total arsenic isn’t the only concern — arsenic speciation (the chemical form) determines toxicity. |
Health & Agronomic Impacts
Straighthead Disease in Rice
Caused by DMA and DMMTA accumulation in grains.
Leads to sterility in rice panicles (grains do not fill).
Yield losses of up to 70% reported in severely affected fields.
Human Health Risks
Chronic arsenic exposure causes:
Cancer (skin, lung, bladder)
Developmental problems in children
Cardiovascular and neurological disorders
Key Findings from the 2025 Global Study
Microbial Composition as a Predictor of Toxicity
Soil Age Matters:
Young Soils (<700 years) → more methylating bacteria → more toxic arsenic.
Old Soils (>700 years) → more demethylating archaea → less toxic arsenic.
Risk Threshold:
When methylator:demethylator ratio > 1.5, risk of straighthead disease spikes.
Global Soil Microbiome Survey
801 paddy soils analyzed.
Identified 11 methylator and 6 demethylator microbial species as toxicity markers.
Policy & Research Implications
What Needs to Be Done:
Soil Microbiome Monitoring – Integrate microbial indicators into soil health assessments.
Water Management – Shift to alternate wetting and drying (AWD) to reduce arsenic mobilization.
Rice Breeding – Develop low-arsenic accumulating rice varieties.
Awareness Campaigns – Especially in rural arsenic-affected belts.
Safe Irrigation Policies – Promote arsenic-free water sources for farming.
Exam Connect – Possible Questions
Prelims
1. Which of the following arsenic compounds found in rice paddies is primarily responsible for straighthead disease in rice crops?
A. Arsenite
B. Arsenate
C. Dimethylarsinic acid (DMA)
D. Monomethylarsinic acid (MMA)
Answer: C. Dimethylarsinic acid (DMA)
2. In rice paddies, arsenic becomes more bioavailable due to which of the following conditions?
A. Aerobic soil and low pH
B. Anaerobic soil and microbial methylation
C. Dry soil and high salinity
D. Sandy soil with low microbial activity
Answer: B. Anaerobic soil and microbial methylation
Mains
1. “Arsenic toxicity in rice is not just an environmental issue but a public health crisis.” Discuss the causes, consequences, and strategies to mitigate arsenic contamination in Indian rice cultivation.
2. Examine how the microbial ecology of soil affects arsenic behavior in rice paddies. How can this scientific insight be integrated into sustainable agricultural practices?
4. What are Green Crackers? – Environment

Why in News?
The Supreme Court of India has temporarily allowed the sale and use of green crackers in the Delhi–NCR region from October 18–21, 2025, during Diwali celebrations.
This move attempts to balance cultural traditions with environmental and public health concerns, especially in pollution-prone regions.
Background: Firecracker Ban & Pollution Crisis
2016–2017 Diwali: Delhi-NCR witnessed hazardous AQI levels (>500) due to widespread use of traditional firecrackers.
The air turned into a toxic smog cocktail — severely affecting respiratory health and prompting emergency measures.
Judicial Intervention
In 2018, the Supreme Court ruled that cultural freedom cannot override the Right to Life (Article 21).
It banned traditional crackers using barium salts, aluminum, and sulfur, directing the Council of Scientific and Industrial Research (CSIR) to develop eco-friendly alternatives.
What Are Green Crackers?
Definition:
Green crackers are eco-friendly fireworks developed to reduce air and noise pollution while preserving the festive spirit.
Developed by:
CSIR–NEERI (National Environmental Engineering Research Institute)
Certified by: PESO (Petroleum and Explosives Safety Organisation)
Chemical Composition Improvements
| Element | Traditional Crackers | Green Crackers |
|---|---|---|
| Barium Nitrate | Present (highly toxic) | Removed |
| Aluminum & Sulfur | High content | Significantly reduced |
| Particulate Matter | High PM2.5 release | 30% lower PM2.5 |
| SO₂ & NOx | Major emissions | 10–20% reduced emission |
Types of Green Crackers (CSIR-certified)
| Type | Full Form | Key Features |
|---|---|---|
| SWAS | Safe Water Releasable Systems | Emits water vapor to suppress dust and temperature rise. Reduces PM. |
| STAR | Safe Thermite Crackers | Uses thermite reaction for light and sound with reduced toxic output. |
| SAFAL | Safe Minimal Aluminum Load | Reduces metallic fuel content while maintaining brightness and sound. |
Sound Level: Maintained at 100–120 decibels, same as traditional crackers but with cleaner combustion and shorter atmospheric residence time.
How to Identify Legal Green Crackers
Each packet must carry:
Green Fireworks Logo
QR Code (verifiable via CSIR-NEERI’s Green QR App)
Absence of QR code = Illegal firecracker
Challenges in Implementation
Lack of Public Awareness
Widespread Availability of Illegal Crackers
Limited Production Capacity of certified manufacturers
Enforcement Gaps at local levels
Pollution Not Fully Eliminated – only partially reduced
Exam Connect – Possible Questions
Prelims
1. Which organization in India is responsible for the development of green crackers?
A. FSSAI
B. CSIR–NEERI
C. DRDO
D. ICAR
Answer: B. CSIR–NEERI
2. What chemical compound is excluded from green cracker formulations due to its toxicity?
A. Magnesium nitrate
B. Potassium chlorate
C. Barium nitrate
D. Zinc oxide
Answer: C. Barium nitrate
Mains
1. “Green crackers represent an attempt to harmonize tradition with environmental responsibility.” Critically examine their effectiveness and challenges in large-scale adoption.
2. Discuss the role of science and technology in managing air pollution during festivals. How can judicial activism and public participation contribute to cleaner celebrations?
5. India’s Post-Diwali Farm Challenge – Economy

Why in News?
India has witnessed negative retail food inflation for four consecutive months leading up to September 2025 — a dramatic reversal from the 8.5% surge in food prices (July 2023 – Dec 2024).
This welcome relief in food inflation, due to two successful monsoon seasons, now poses a new challenge:
Post-Diwali distress for farmers due to low crop prices and market oversupply, especially in wheat, rice, and soyabean.
The Inflation to Deflation Shift
| Period | Trend | Cause |
|---|---|---|
| 2023–24 | High food inflation | El Niño-induced drought → supply shortages |
| 2025 (till Sep) | Negative food inflation | Strong monsoons → bumper harvest → oversupply |
Key Agricultural Trends
1. Cereal Surplus (Wheat & Rice)
Wheat stocks (as of Oct 1): 320.3 lakh tonnes – well above buffer norms.
Rice stocks: 4.4 times higher than minimum requirements.
Result: Prices falling below MSP, leading to farmer distress in cereal-producing states (e.g., Punjab, Haryana, UP).
2. Soyabean Paradox
Production fell to a 5-year low (105.4 lakh tonnes) due to:
Reduced acreage
Erratic rainfall
Yet prices remain low due to:
Global soyabean glut
Cheaper substitutes like DDGS (Distiller’s Dried Grains with Solubles) in livestock feed
Weak domestic consumption of soyameal
Economic & Policy Implications
For Farmers
MSP Ineffectiveness: Market prices of key kharif crops (soyabean, pulses, maize) are below MSP.
Leads to distress selling, especially post-Diwali when arrivals increase.
For Government
Balancing consumer welfare (low food prices) with farmer income stability is the core challenge.
Potential policy actions:
Reinstating import duties on oilseeds to curb cheap imports
Increasing MSPs selectively for rabi crops
Expanding procurement of non-cereal crops
Promoting value-addition and agro-processing to absorb surplus
Long-Term Structural Issues
Overdependence on MSP Crops: Wheat and rice dominate procurement, creating imbalanced production incentives.
Poor Post-Harvest Infrastructure: Lack of storage, drying, and processing facilities increases post-harvest losses.
Export Challenges: Global commodity cycles affect domestic realizations, especially for oilseeds.
Price Volatility: No robust price risk mitigation mechanisms for farmers.
Exam Connect – Possible Questions
Prelims
1. The decline in soyabean prices in India during 2025, despite a fall in production, can be attributed to which of the following factors?
1.Global oversupply of soyabean meal
2.Cheaper substitutes like DDGS
3.High MSP set by the government
4.Increase in domestic demand for soyameal
Select the correct answer using the code:
A. 1 and 2 only
B. 1 and 3 only
C. 1, 2, and 4
D. 2, 3, and 4
Answer: A. 1 and 2 only
2. Which of the following crops are most associated with Minimum Support Price (MSP) procurement in India?
A. Maize and Pulses
B. Wheat and Rice
C. Mustard and Soyabean
D. Groundnut and Cotton
Answer: B. Wheat and Rice
Mains
1. “The success in curbing food inflation has come at the cost of farmer welfare.” Critically examine this statement in the context of post-Diwali agricultural price trends in India.
2. Discuss the role of procurement policies and MSP in ensuring agricultural stability. How can India recalibrate its farm policies to balance consumer needs with farmer incomes?
6. Rangarajan Poverty Line: Revisiting India’s Poverty Metrics – Economy
Why in News?
Economists from the Reserve Bank of India (RBI) have revisited India’s poverty estimates using updated data from the 2022–23 Household Consumption Expenditure Survey (HCES). The methodology is based on the framework developed by the C. Rangarajan Committee (2014) — the last official update to India’s poverty line.
Evolution of Poverty Measurement in India
| Committee | Year | Key Contributions |
|---|---|---|
| Planning Commission | 1962 | ₹20 (rural) / ₹25 (urban) per month – ignored health & education |
| Dandekar & Rath | 1971 | Introduced 2250 kcal/day as benchmark |
| Y.K. Alagh Committee | 1979 | Calorie-linked poverty line (2400 kcal rural, 2100 kcal urban) |
| Lakdawala Committee | 1993 | State-specific consumption baskets, price adjustments |
| Tendulkar Committee | 2009 | Shift to expenditure-based measure with uniform consumption basket |
| Rangarajan Committee | 2012–14 | Introduced broader consumption basket with realistic inclusions (health, education, rent) |
C. Rangarajan Committee (2014): Key Features
Objective: Define poverty using a more holistic and realistic metric, beyond mere calorie intake.
Methodology:
Used Modified Mixed Reference Period (MMRP) for survey data.
Included food, housing, education, health, clothing, and transport.
Poverty Line (2011–12 Prices):
₹972/month (rural) → ₹32/day
₹1,407/month (urban) → ₹47/day
Poverty Estimate (2011–12):
29.5% of India’s population was below poverty line.
Key Shift from Tendulkar: Expanded the scope of necessary expenses. Calorie intake became a part, not the basis.
2025 RBI Reassessment
Data Source:
HCES 2022–23 covering 20 major states.
Methodology:
Maintained Rangarajan’s framework.
Developed a new Poverty Line Basket (PLB) Price Index, which reflects consumption inflation better than CPI.
PLB Composition Differences:
| Item Share | Rural | Urban |
|---|---|---|
| Food (PLB) | 57% | 47% |
| Food (CPI) | 54% | 36% |
PLB focuses on essential expenditure patterns, especially for low-income groups.
Key Findings (2025 Update)
| State | Rural Poverty | Urban Poverty |
|---|---|---|
| Odisha | 47.8% → 8.6% | – |
| Bihar | – | 50.8% → 9.1% |
| Himachal Pradesh | 0.4% (lowest) | – |
| Tamil Nadu | – | 1.9% (lowest) |
| Chhattisgarh | 25.1% (highest) | 13.3% (highest) |
Significance of the Update
Confirms substantial poverty reduction in many regions.
Reinforces importance of real-time consumption data.
Highlights regional disparities, particularly in eastern and central India.
Suggests the need to update India’s official poverty line to reflect present-day cost structures.
Challenges in Poverty Measurement
No Official Update Since 2014 – Policy still relies on outdated benchmarks.
Monetary Measures Alone Are Inadequate – Don’t capture multi-dimensional deprivations.
State-level Price Variations – National averages mask cost-of-living differences.
Policy Disconnect – Social schemes not always aligned with updated poverty realities.
Way Forward
Adopt Updated Official Poverty Line with regular revisions.
Combine monetary and multidimensional poverty metrics (e.g. MPI).
Focus on state-specific poverty alleviation strategies.
Use poverty estimates to target welfare schemes more effectively (e.g., PMGKAY, PMAY, MGNREGA).
Exam Connect – Possible Questions
Prelims
1. Which of the following elements were newly included in the poverty basket by the Rangarajan Committee (2014)?
1.Calorie intake
2.Healthcare
3.Education
4.Housing and rent
Select the correct answer:
A. 1 and 2 only
B. 2, 3 and 4 only
C. 1, 2, 3 and 4
D. 1 and 4 only
Answer: C. 1, 2, 3 and 4
2. The new price index developed by the RBI in 2025 for poverty estimation is based on:
A. CPI Inflation
B. WPI Index
C. Poverty Line Basket (PLB) Index
D. GDP Deflator
Answer: C. Poverty Line Basket (PLB) Index
Mains
1. “India needs a poverty line that reflects current realities and regional variations.” Discuss with reference to the Rangarajan Committee and RBI’s 2025 poverty update.
2. Examine the evolution of poverty measurement in India. How has the focus shifted from calorie-based methods to broader indicators of deprivation?

